
Rigsight
Know your rig. A free PC monitor for Windows that records your temperatures, app time, internet use and crashes all day, and keeps them as history.
Or paste this into PowerShell
irm https://rigsight.app/install.ps1 | iexWhy Rigsight
Most monitors forget.
Rigsight remembers.
Pick any day and it's all still there: what was running, how hot it got, and the minute it happened.

A normal hardware monitor
- Shows numbers only while you're watching
- Close it, and the numbers are gone
- "Did it overheat last night?" — no idea
Rigsight
- Records all day, even with its window closed
- Any day, week, month or year, minute by minute
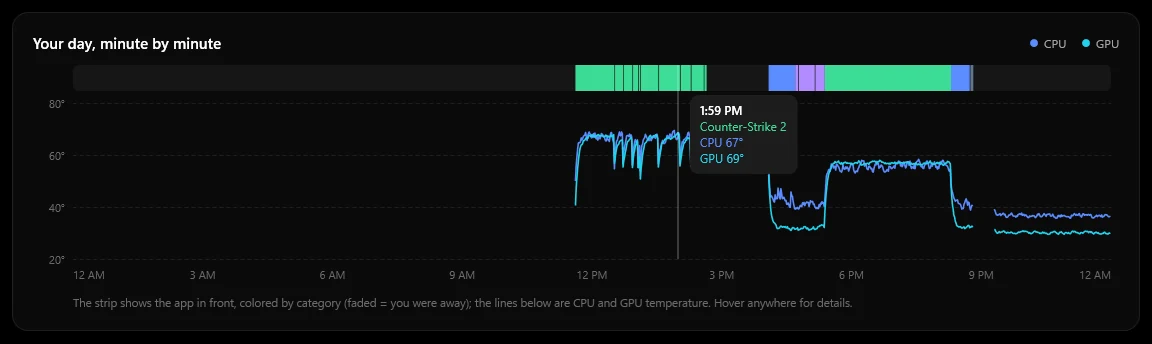
- "GPU hit 70° at 1:59 PM in Counter-Strike 2" — yes
What happened
Look back at any day.
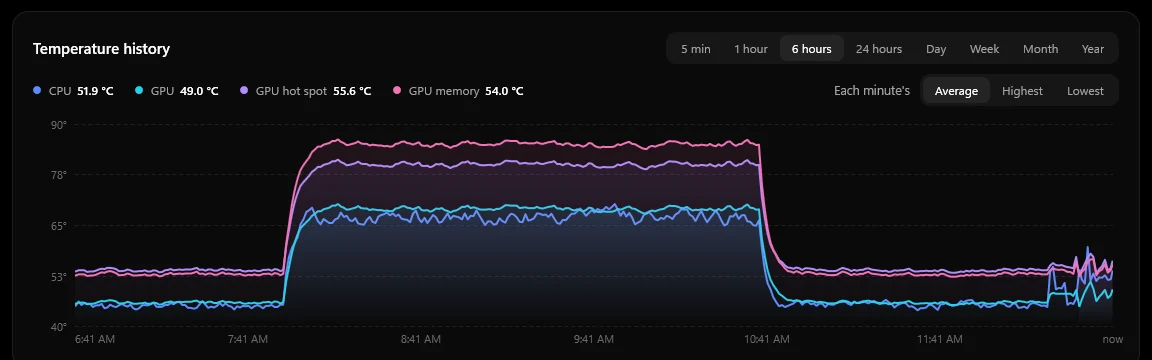
Every degree, with a timestamp.
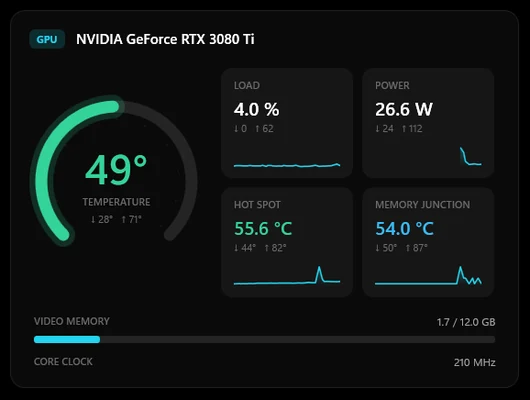
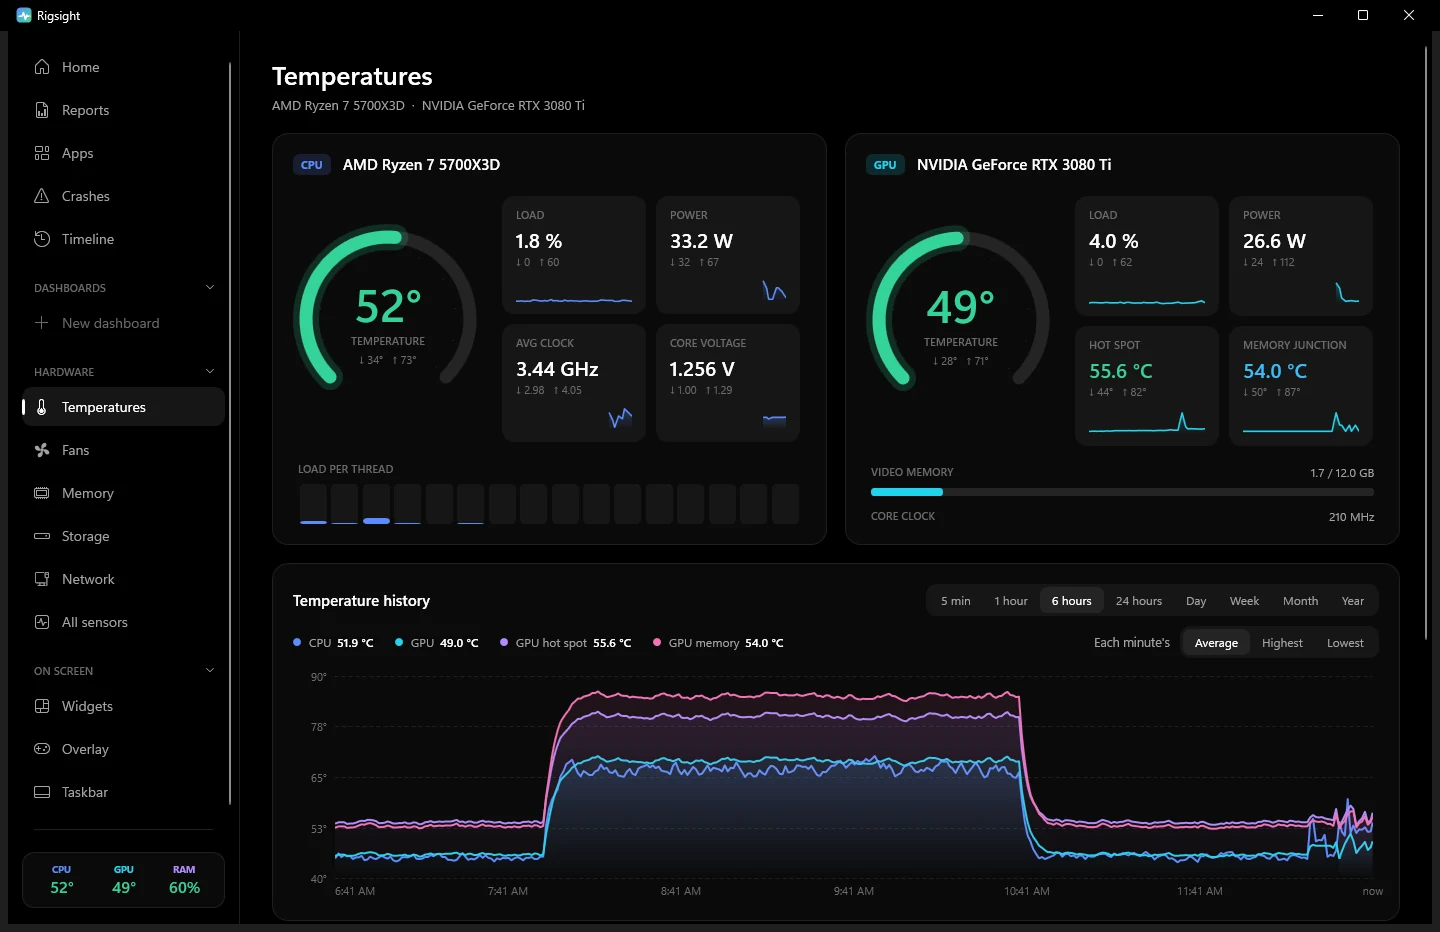
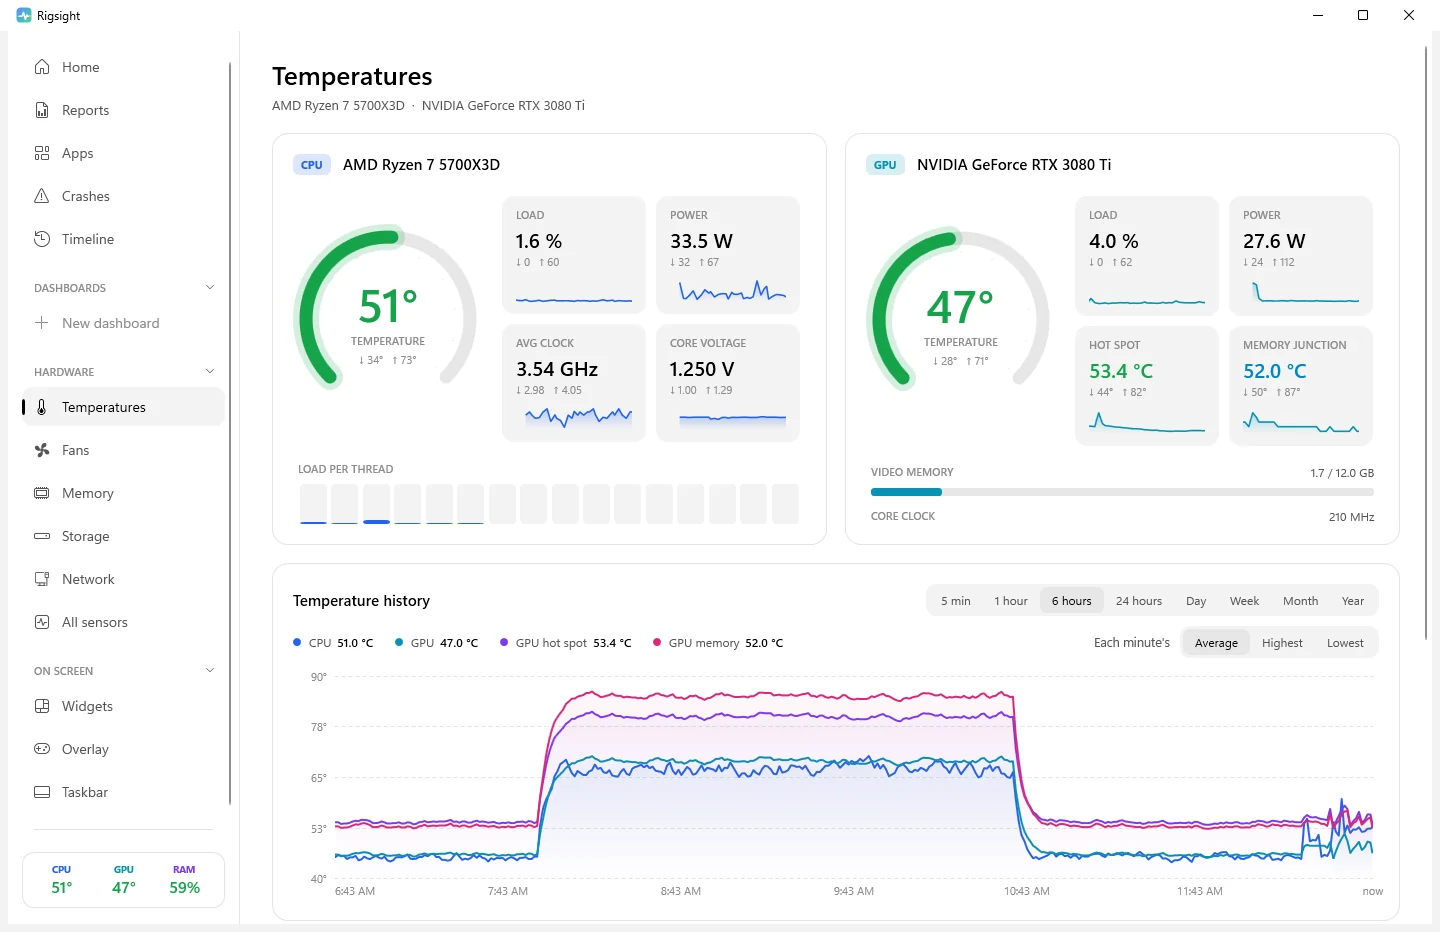
Live CPU and GPU gauges, hot spot and memory junction, per-core load, fans, clocks, power and voltages. Each shows today's low and high, recorded even when the window is closed.
- History from the last 5 minutes to any day, week, month or year
- Draw each minute's average, highest or lowest, and hover for all three
- Shows where nothing was recorded, and why: PC off, asleep or a crash
- Alerts that ignore one-second spikes and only fire when it stays hot

Any day, week, month or year.
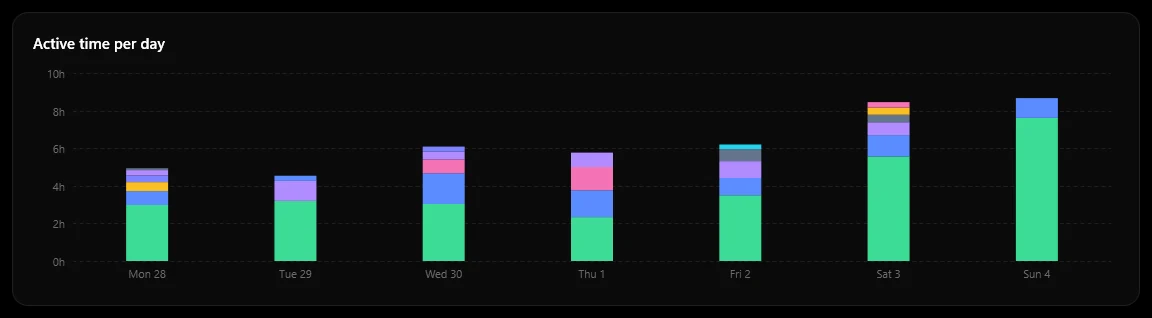
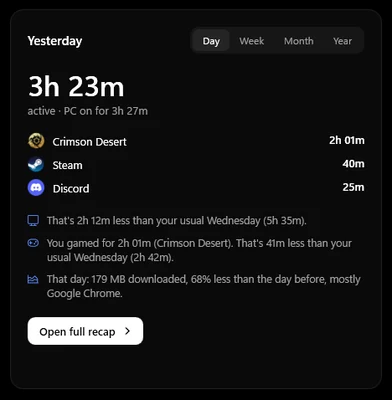
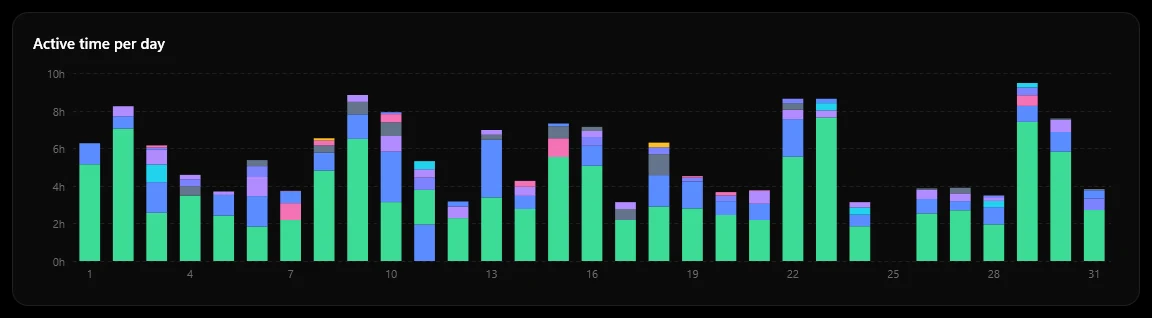
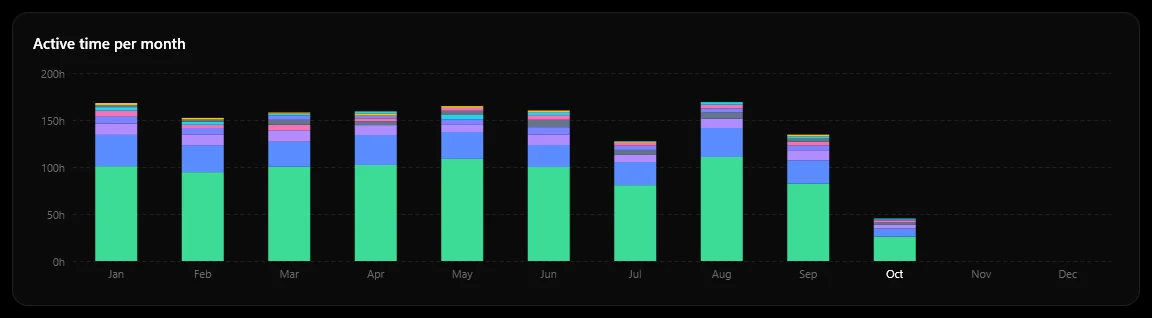
A day shows which app was in front each minute, with CPU and GPU temperature drawn over it. A week, a month or a year shows where the time went, with your peaks and when they happened.
- Active time vs. time the PC was just on
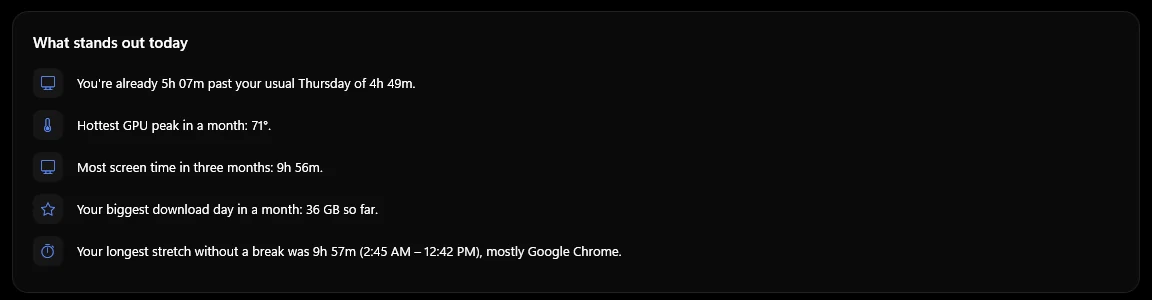
- Highlights that only speak up when something stands out: who made the heat, records, a fan turning slower than it used to
- Temperatures compared with your usual, idle with idle and load with load, this week and months ago

When something goes wrong
Find out why.
Crashes, explained in plain words.
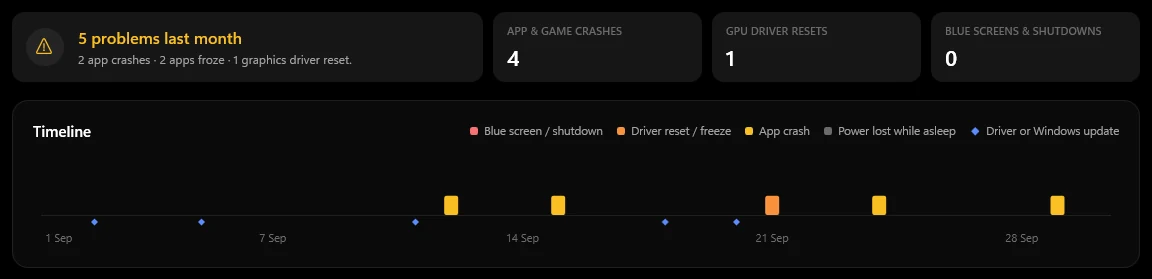
Game crashes, freezes, graphics driver resets, blue screens and sudden shutdowns, read from Windows' own logs and translated into what probably happened and what to try.
- The temperatures and game right before each crash
- "What changed before": drivers and updates installed in the days before
- Search by app or error, patterns, one-click reports to paste in a forum, and mute for noisy apps

What changed on your PC, day by day.
Drivers and Windows updates, apps installed, updated or removed, what starts with Windows, new hardware, the BIOS and the settings that matter. Each one on the day it happened, down to a switch of power plan.
- After a driver or an update: whether problems went up or down since
- A calendar to jump to any day, with problem days marked
- Search for any app, driver or version; by day, or a whole month in one row

Part by part
Every part of your PC, on its own page.
Where your time and heat go.
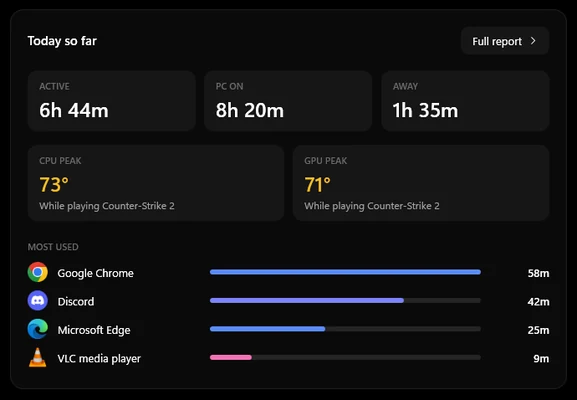
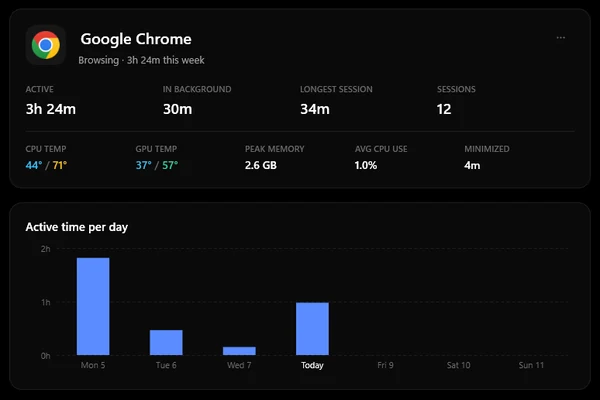
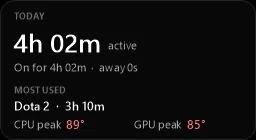
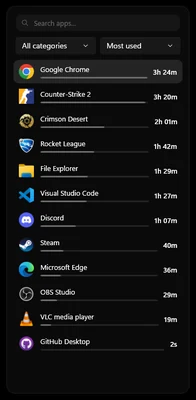
Every app and game, measured: time you actually used it, time it sat in the background, and time it was minimized. See how hot each one runs your CPU and GPU, and how much memory it takes.
- Any day, week, month or year, or all time
- A fullscreen game counts as in use even on a controller
- Rename apps, set categories, or never track one

Everything running, in one list.
Every app that is running right now, with its memory, processor, internet and disk use side by side. Sort by any of them, open an app to see each of its processes, and end the ones you don't need.
- Open a browser to see which tab is taking the memory
- Each app with its usual memory and recent crashes
- End a task, with a clear warning before anything Windows depends on

Where your internet goes.
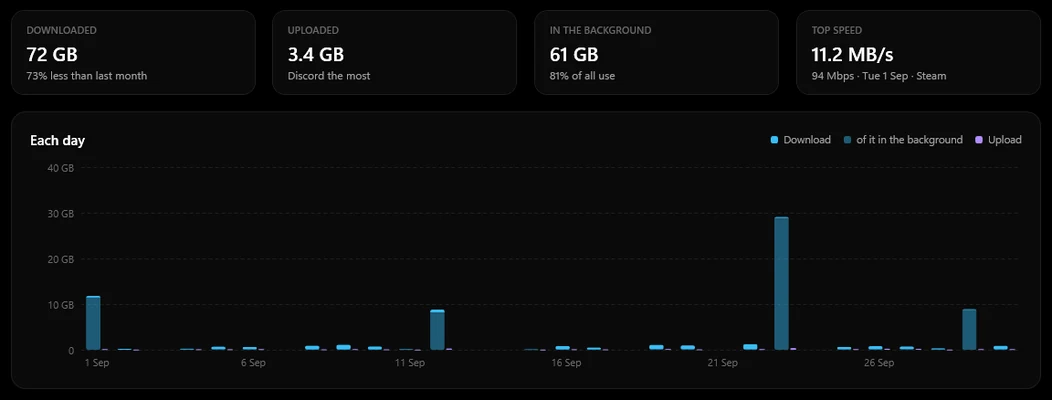
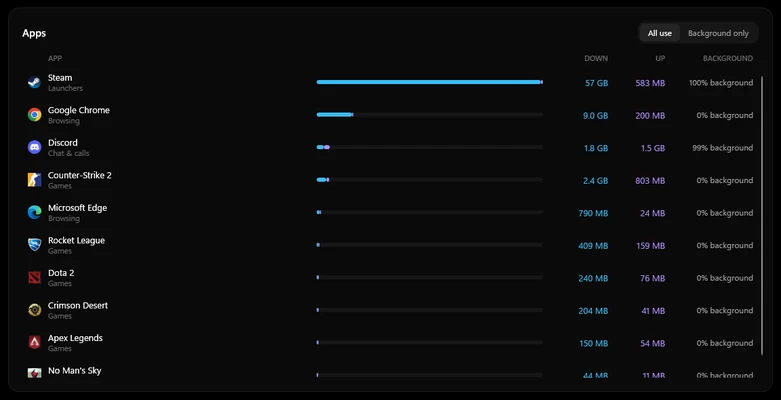
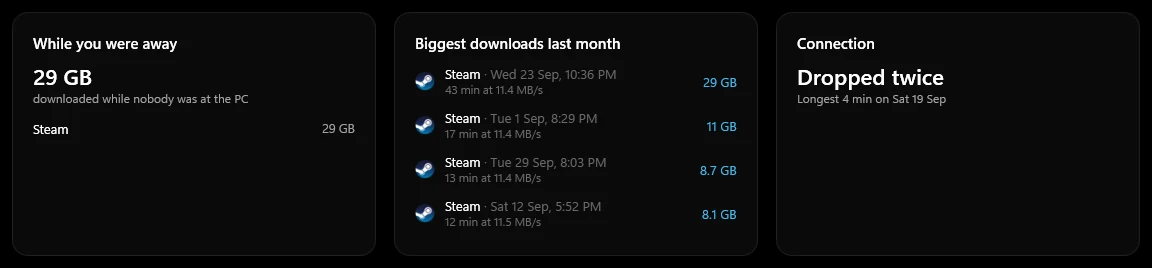
How much you downloaded and uploaded, and which app used it. Each app's use is split into what you were using, what ran in the background, and what downloaded while you were away.
- Any day, week, month or year, with your biggest downloads
- Spots apps that quietly use your internet in the background
- Notices when your connection drops, or downloads get slower than usual

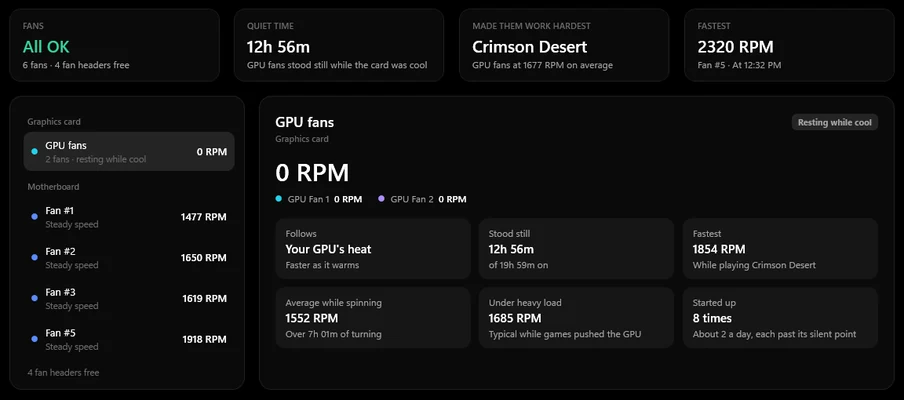
Every fan, and what wakes it up.
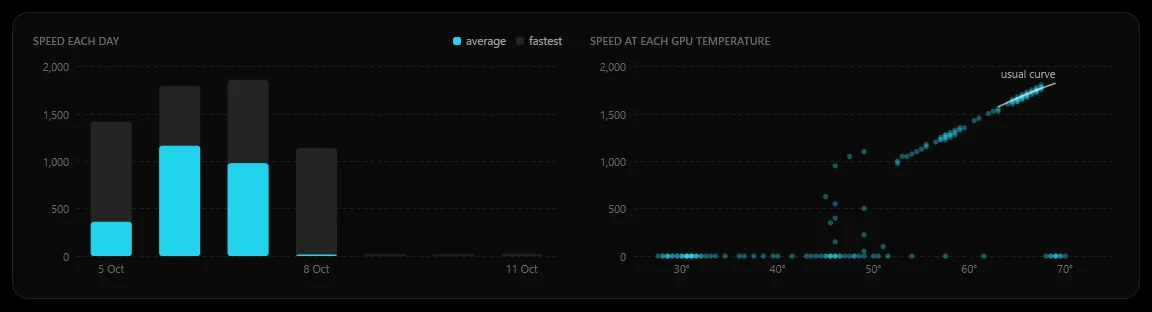
Every fan on your graphics card and motherboard. See when your GPU fans start spinning, how long they stood still, how fast they turn at each temperature, and which game made them work hardest.
- Any day, week, month or year
- A quick check that every fan is OK
- A heads-up when a fan stops or turns slower than it used to

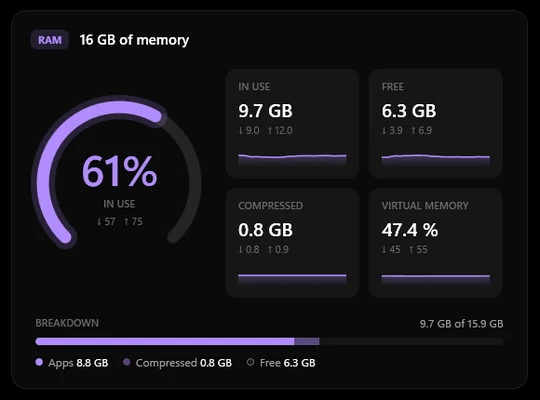
What's filling your RAM.
How much memory is in use, free and compressed, and which apps are using it right now. Open an app to see each of its processes: every browser tab, every Windows service.
- The heaviest apps stand out at a glance
- Today's biggest memory users, with their peaks
- Search the live list for any app

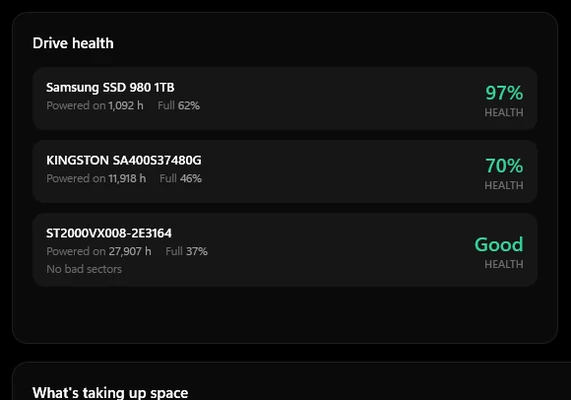
How full, and how healthy.
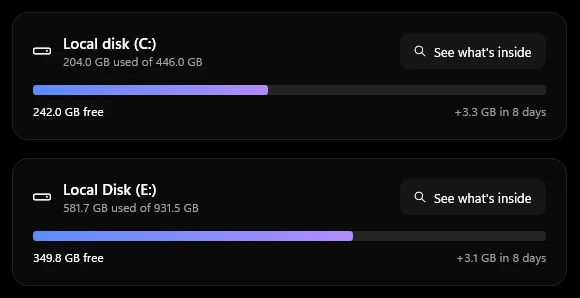
How full each drive is and how fast it's filling. SSD wear, SMART health and bad sectors, and a map of what's taking the space.
- Space you could free: caches, temporary files, old downloads
- See what's inside any drive or folder
- Nothing is deleted for you: it shows where the space is, and you decide

Without opening the window
Your numbers, where you want them.
Your numbers, inside the game.
Press Alt Shift O in any game. FPS, 1% lows, frame time, CPU and GPU temperature, load, clock and power, VRAM, RAM, and up to 10 of your own sensors.
- Works in exclusive fullscreen, through RivaTuner (installed for you)
- Colour or grayscale; fade the panel and the numbers separately
- Never takes focus; clicks pass straight through
- Rigsight never hooks into games, so it's safe with anti-cheat
Small readouts on your desktop.
Seven ready-made widgets, from FPS to a temperature graph, or make your own: a bar, tiles, gauges or a graph with any readings you like.
- Edit any of them, in dark, grey or light, colour or grayscale, in sizes up to 3XL
- Drag one anywhere, or lock it so clicks pass straight through
- They step aside while you play

Readings beside the clock.
Put temperatures, load and power right in the taskbar, next to the clock, where they are always in view.
- In the taskbar itself, an icon for each reading, or an icon per part
- A colour for each part, or grayscale
- Pick any readings and put them in your order

And the rest of your rig
Everything else you'd want to know.
Your own dashboards
Start from a preset made for your PC's sensors, or build pages from gauges, charts and any single sensor. Drag tiles anywhere, resize them, make one for gaming and one for work.
Calm notifications
A daily recap, game session summaries and temperature alerts. Alerts reach you even in fullscreen games; anything else waits until you leave.
Every sensor
Every sensor your hardware exposes (over 200 on a typical gaming PC), searchable, renamable and grouped in the order you choose. NVIDIA, AMD and Intel.
Updates itself
New versions download quietly and install the next time you start your PC. Nothing to remember.
Looks
Black. Or white.
Pure black, a softer dark grey, or pure white, with colour only where it means something: a temperature, a warning, a crash. Or let it follow Windows, and add an accent colour if you like. Drag to compare.
Built to be invisible
Records all day.
You'll never notice it.
Rigsight records quietly in the background and uses almost nothing. The window only runs while you have it open.
Your data never leaves your PC.
No account. No telemetry. The only thing Rigsight ever checks online is whether there's a new version. Everything else lives in one folder on your PC, and you can clear it with one click. This website counts its visits without cookies, and the app has no part in that.
Get started
Running in two minutes.
- 1
Download
Grab the installer. It's free, with no account and no ads.
- 2
Install
Accept the one admin prompt. It sets up the recorder to start with Windows, plus the free sensor driver and RivaTuner if you want them.
- 3
Forget about it
Use your PC as usual. Open Rigsight whenever you're curious; the history is already there.
If you download the installer and Windows says "Windows protected your PC", click More info → Run anyway.
or use one command
One command
Paste this into PowerShell and Rigsight installs itself. Run it again whenever you want the latest version.
irm https://rigsight.app/install.ps1 | iexQuestions
Is it really free?
Yes. Rigsight is free and open source under the MIT license. No trial, no premium tier, no ads.
Does it work with AMD and Intel?
Yes. Hardware is read through LibreHardwareMonitor, which supports NVIDIA, AMD and Intel graphics cards and Intel and AMD processors. NVIDIA cards also get an extra-light fast path.
How is it different from HWiNFO or MSI Afterburner?
Hardware monitors like HWiNFO, HWMonitor and MSI Afterburner show what your PC is doing right now. Rigsight reads the same kind of sensors but records them all day, so you can open any past day and see how hot it ran, which game was running and what crashed. You can use it alongside them.
Can it show how long I use each app?
Yes. Rigsight is also a screen time and app usage tracker for Windows: it reports how long each app and game was in use, in the background or minimized, for any day, week, month or year.
Will the overlay get me banned?
Rigsight never hooks into games. Over borderless and windowed games its overlay is an ordinary always-on-top window. For exclusive fullscreen it uses RivaTuner Statistics Server, the long-established tool behind MSI Afterburner's overlay, which anti-cheat systems accept.
Will it slow my games down?
No. In the background Rigsight uses around 0.02% of your CPU and runs at low priority, so your games always come first.
What does it record, exactly?
Which app is in front and for how long, and how hard your hardware is working: temperatures, loads, clocks, power, fans, memory and drives. It also counts how much each app downloads and uploads. It never records window titles, keystrokes, screenshots, file contents or the websites you visit, and none of it is sent anywhere.
How do I update it?
You don't have to. New versions download quietly in the background and install the next time you start your PC. Want it sooner? Click Restart in the app and you're on the new version in seconds.
How much history does it keep?
As much as you like, from three months to forever. Temperatures, app time, sessions and crashes all go back equally far, so any day you look back on is complete. A year of history takes about 35 MB.
How do I uninstall it?
Settings → Apps → Rigsight → Uninstall. That removes the program and its startup task. Your history stays in %LocalAppData%\Rigsight until you delete the folder.